ThreatStream Actors by Region and Industry Dashboard
The ThreatStream Actors by Region and Industry dashboard is an out-of-the-box Anomali-curated dashboard. The data available on the dashboard panels is updated every 24 hours and can be filtered by target industries, source locations, and target locations.
To access the Actors by Region and Industry dashboard, navigate to Dashboard > Library and locate the ThreatStream Actors by Region and Industry dashboard using the Search field.
To access the ThreatStream Actors by Region and Industry dashboard in the classic UI:
-
Navigate to Dashboard > Library.
-
Click the ThreatStream Dashboards folder.
-
Click ThreatStream Actors by Region and Industry.
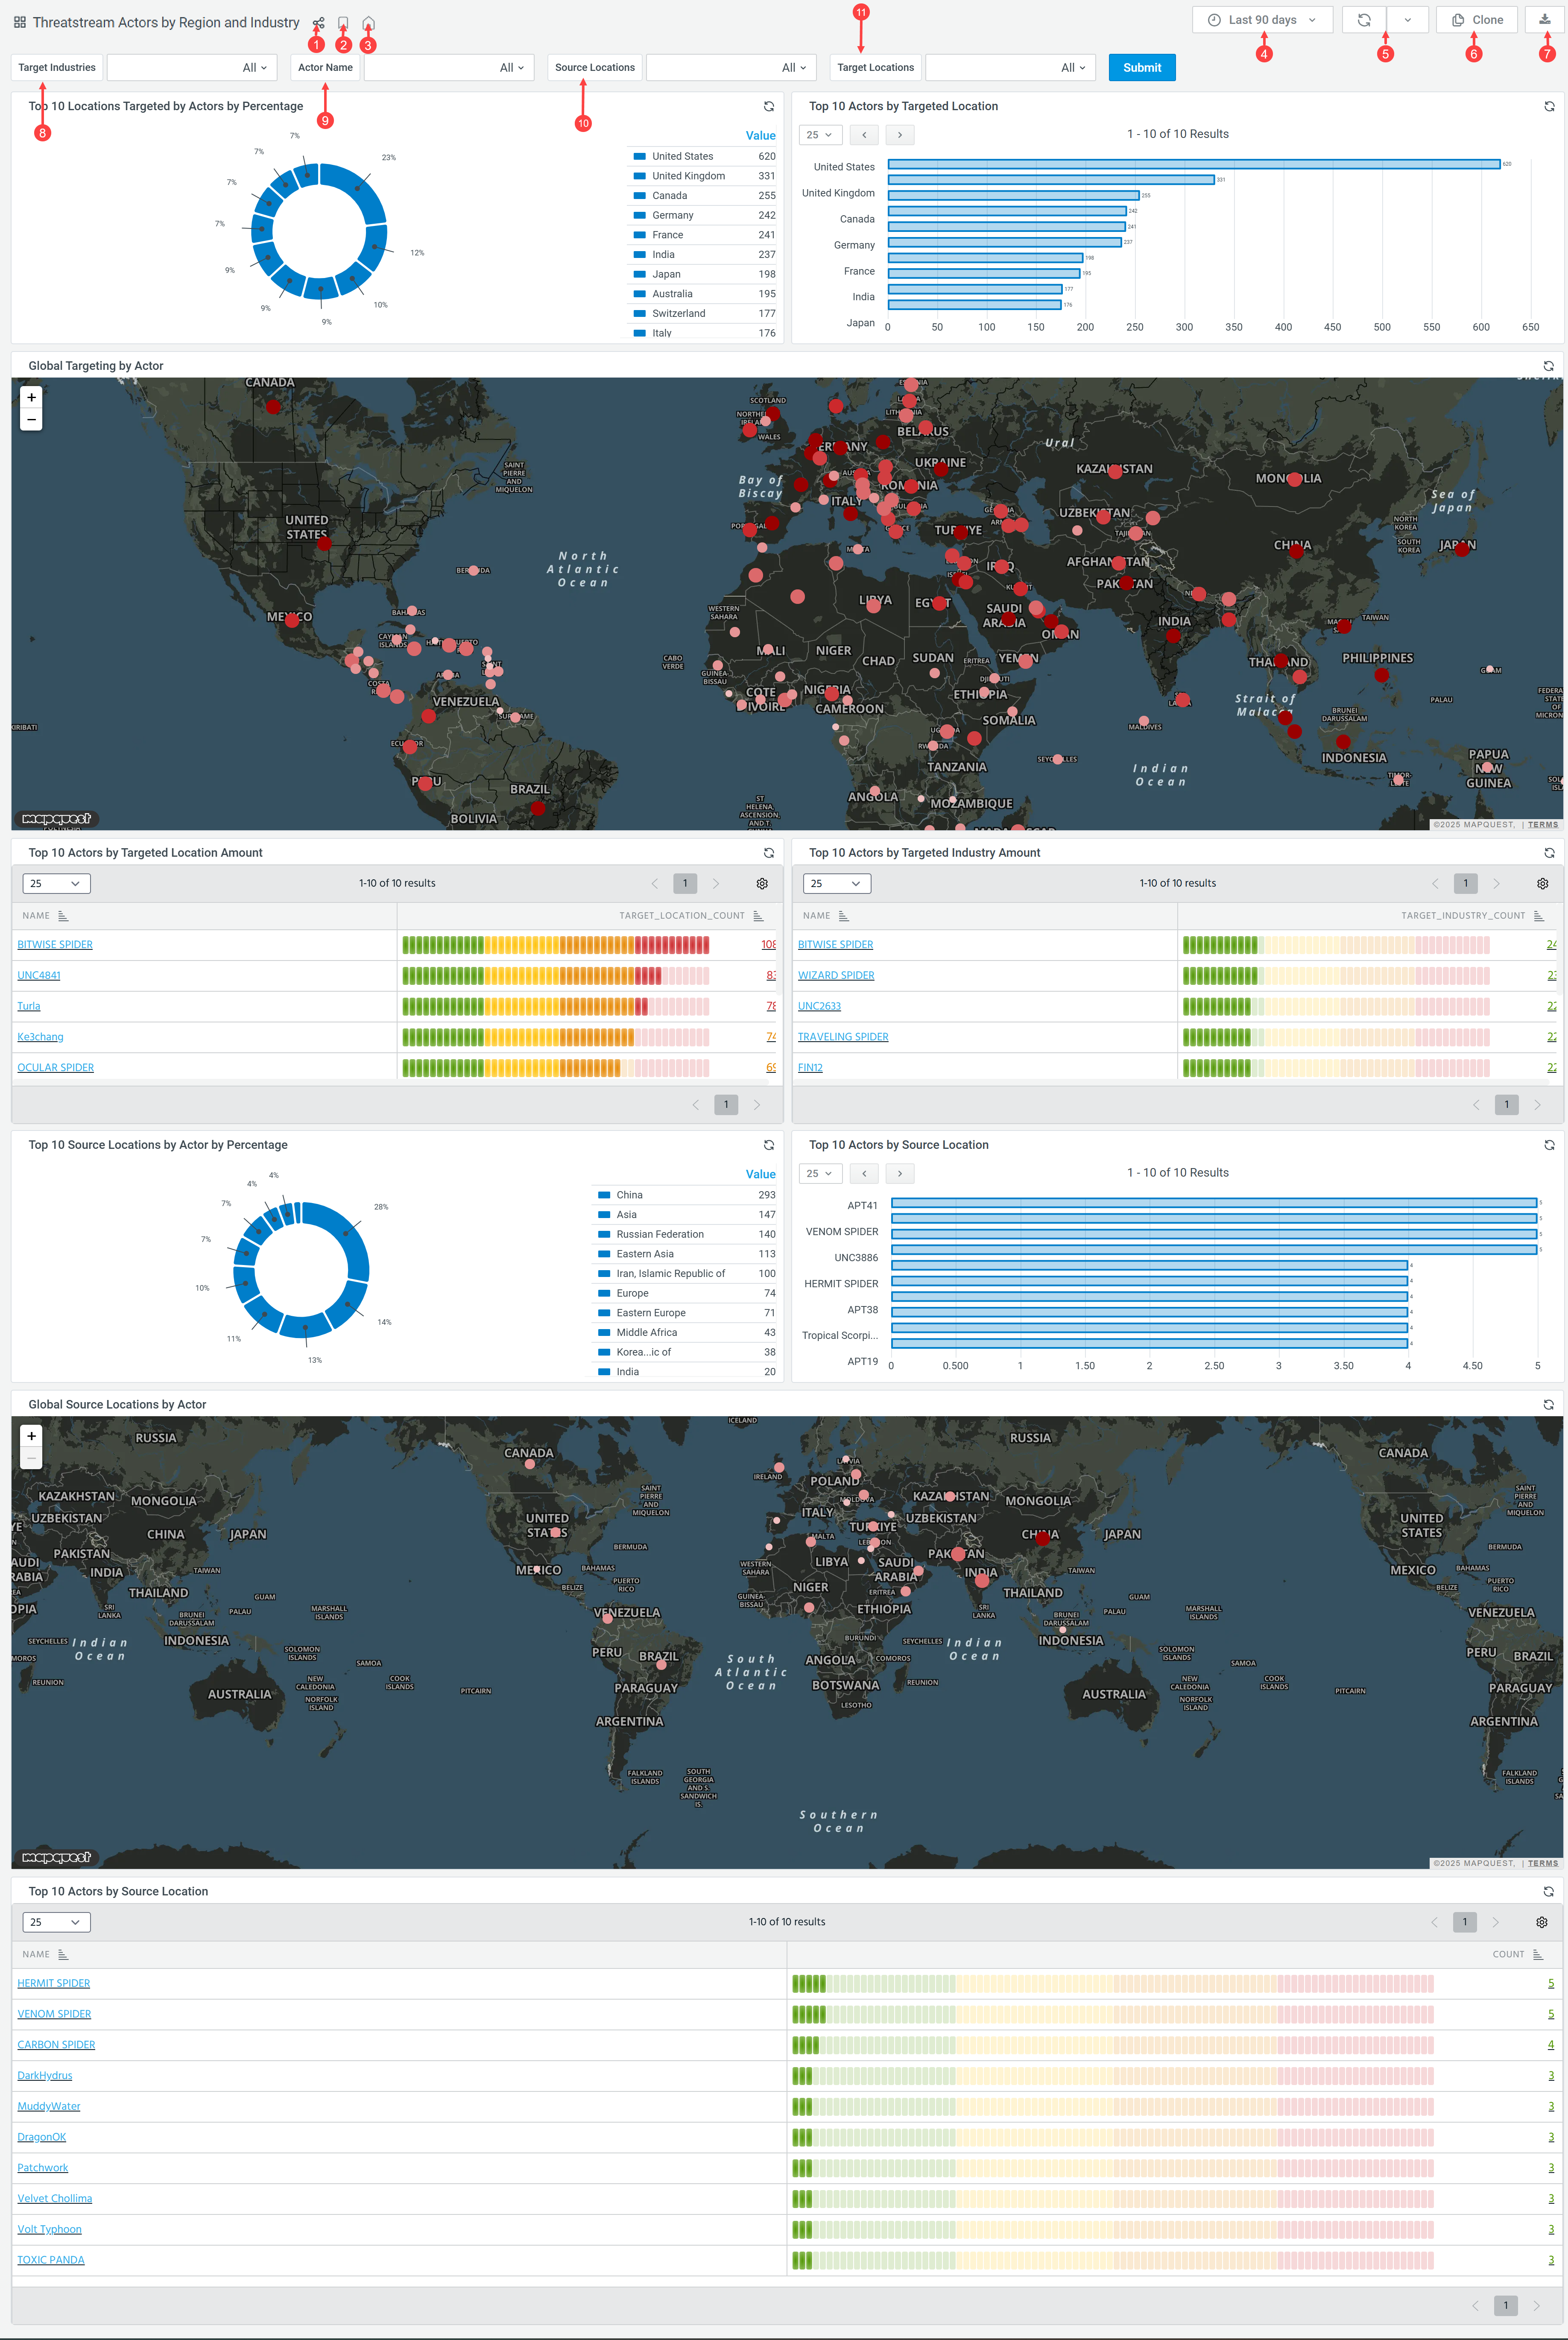
(Click the image to enlarge it)

|
Share the dashboard by copying the dashboard URL or exporting it in JSON format. For details, see Sharing Dashboards or Sharing Dashboards (Classic UI) if you use the classic UI. |

|
Add the dashboard to the list of favorites. All your favorite dashboards can be found in the Bookmarked section of the Dashboard menu. |

|
Designate the current dashboard as your primary dashboard. The setting is saved per user, so each user in the organization can designate their own primary dashboard. The name of the primary dashboard appears as the first item in the Dashboard menu. |

|
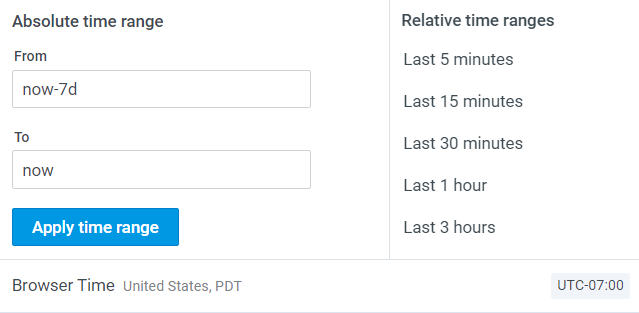
Select a time range for the data displayed on the dashboard. You can select an absolute time range or a relative time range. By default, data for the last 7 days is displayed.
|

|
Select a time range for refreshing the dashboard. Select Off if you don’t want to refresh the dashboard. Click |

|
Clone the dashboard. For details, see Cloning Dashboards or Cloning Dashboards (Classic UI) if you use the classic UI. |

|
Export the dashboard in PDF format. For details, see Exporting Dashboards in PDF Format or Exporting Dashboards in PDF Format if you use the classic UI. |

|
Select a target industry and click Submit. |

|
Select an actor's name and click Submit. |

|
Select a source location and click Submit. |

|
Select a target location and click Submit. |
 to force dashboard refresh.
 ThreatStream Actors by Region and Industry Dashboard Panels
The table contains the list of all panels available on the ThreatStream Actors by Region and Industry dashboard. You can apply the Target Industries, Actor Name, Source locations, and Target Locations filters to sort data according to your needs.
| Panel | Description |
|---|---|
| Top 10 Locations Targeted by Actors by Percentage | Top 10 locations targeted by actors (percentage). |
| Top 10 Actors by Targeted Location | Top 10 actors based on targeted locations. |
| Global Targeting by Actor | Global heatmap displaying locations targeted by threat actors. Hover over a red dot to view the number of actors targeting the location of your interest. Click on a red dot to view actor's details. |
| Top 10 Actors by Targeted Location Amount | Top 10 actors based on targeted locations (amount). |
| Top 10 Actors by Targeted Industry Amount | Top 10 threat actors based on target industries (amount). |
| Top 10 Source Locations by Actors by Percentage |
Top 10 source locations of threat actors (percentage). |
| Top 10 Actors by Source Location | Top 10 actors based on their source locations. |
| Global Source Locations by Actor | Global heatmap of source locations of actors. Hover over a red dot to view the number of actors in the source location of your interest. Click on a red dot to view actor's details. |
| Top 10 Actors by Source Location | Top 10 actors based on their source location. |
All ThreatStream Actors by Region and Industry dashboard panels have the management menu allowing you to take the following actions:
-
Open a panel query in Event Search
-
View a full-screen version of a panel
-
Share a panel with other ThreatStream users in your organization.
-
Inspect panel data
-
Refresh panel data
For details, refer to Managing Dashboard Panels or Managing Dashboard Panels (Classic UI) if you use the Classic UI.